Our Clients
Our Clients
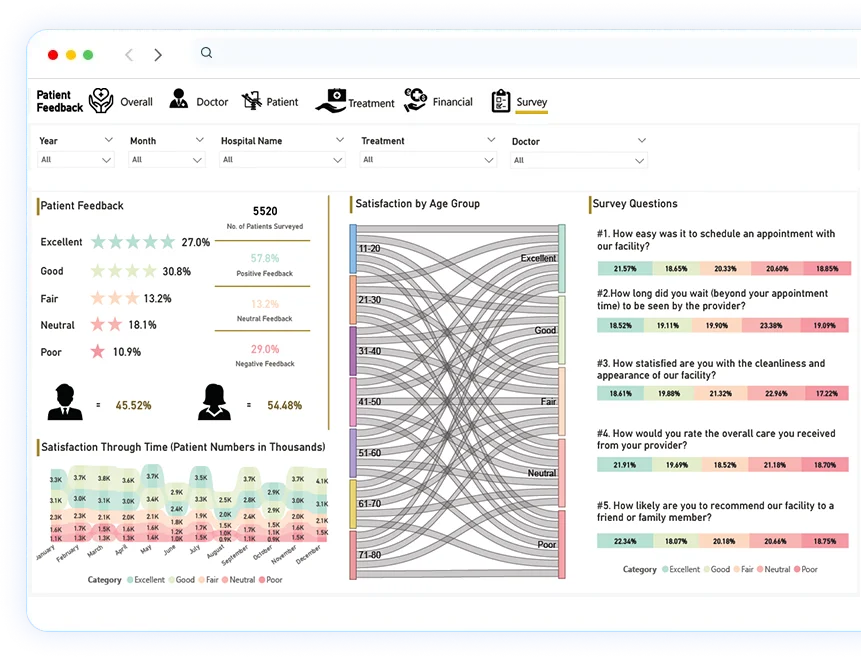
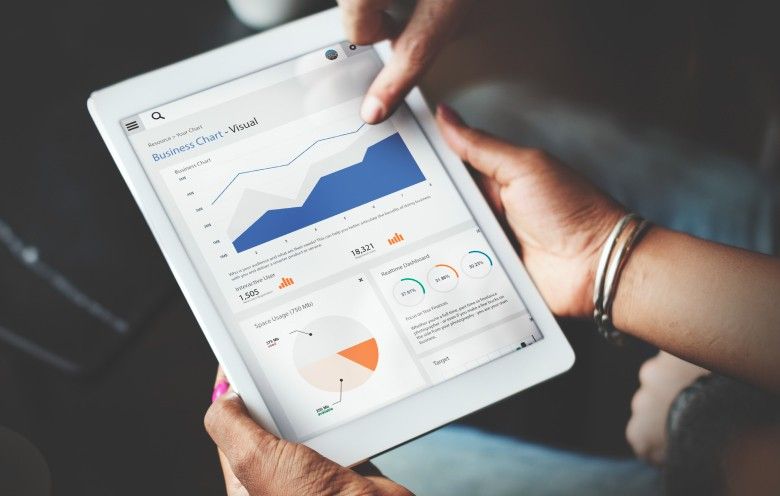
Data holds immense potential when understood visually. Our data visualization services decode intricate datasets, delivering crystal-clear insights that empower strategic decision-making and organizational transformation. With the right data visualization tools, our expert team translates complex information into intuitive, interactive dashboards and graphics. We leverage advanced platforms like Tableau, Power BI, and Logi Analytics to transform raw data into actionable, visually stunning representations. We translate data’s silent language into vivid visual narratives that can drive strategic breakthroughs for you.

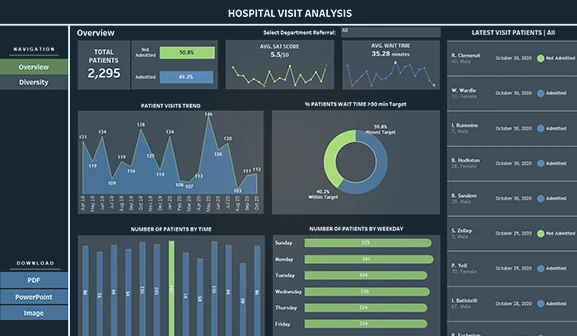
Revolutionize your data landscape with custom dashboards engineered for precision and clarity. Experience a new level of insight as you transform raw data into strategic assets.

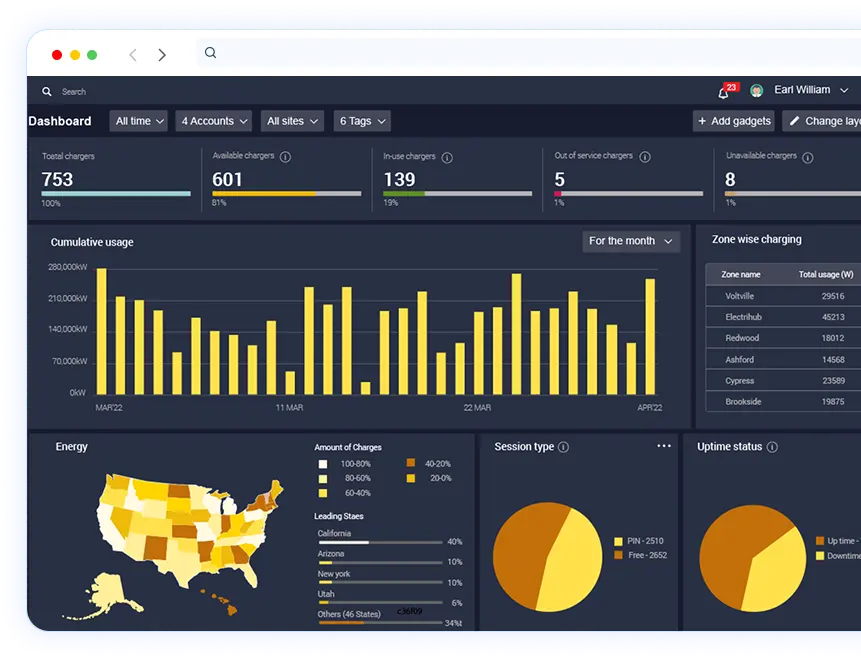
Leverage a cutting-edge BI platform that seamlessly integrates and elevates your data ecosystem. Our BI development solutions empower you with a unified view for strategic dominance and operational excellence.

Enhance your data’s impact with optimized visualizations that bring clarity to complex information. Our data visualization experts refine your visuals to ensure you uncover actionable insights efficiently.

Gain a competitive edge with real-time data monitoring that delivers instantaneous visibility and actionable intelligence. Stay agile and responsive to emerging trends with live data insights.

Navigate the data landscape with confidence through our expert strategy and consulting services. We provide tailored guidance to optimize your data strategy and achieve measurable business outcomes.
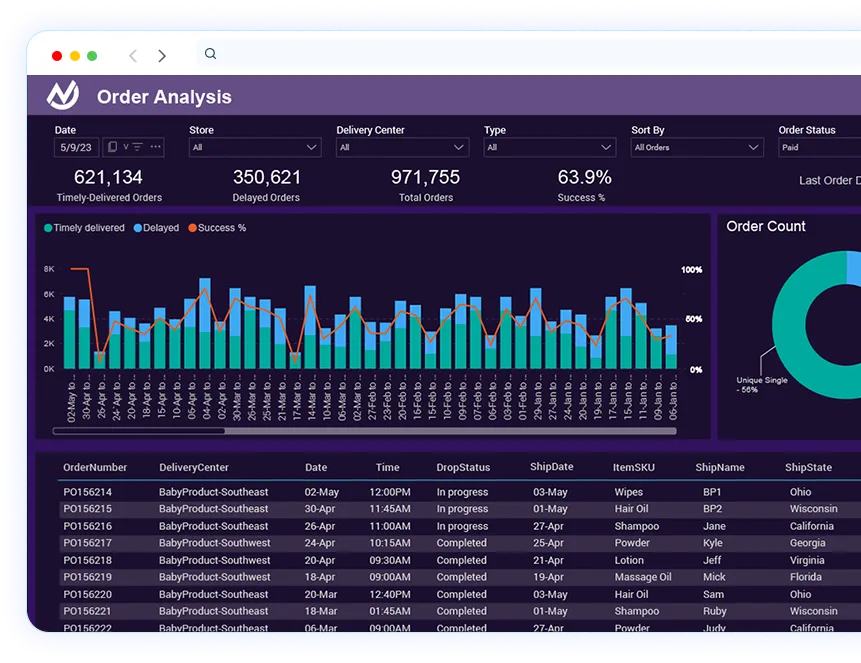
Industry:
Manufacturing
Technologies
Power BI, Snowflake
Challenges
Business impact
Client
A leading baby products manufacturer

10+ years of experience in creating data visualization solutions across industries.
60+ experts in Tableau, Power BI, and Logi Analytics for data visualization and transformation.
350+ dashboards created using Power BI and Tableau for better insights.
Intuitive interfaces for non-technical users with Power BI and Tableau.
Adherence to governance and compliance for enterprise environments with Looker and Power BI.
Discuss your requirements with our data visualization consultants