data-visualization-intro

Transforming complex data into compelling visual narratives

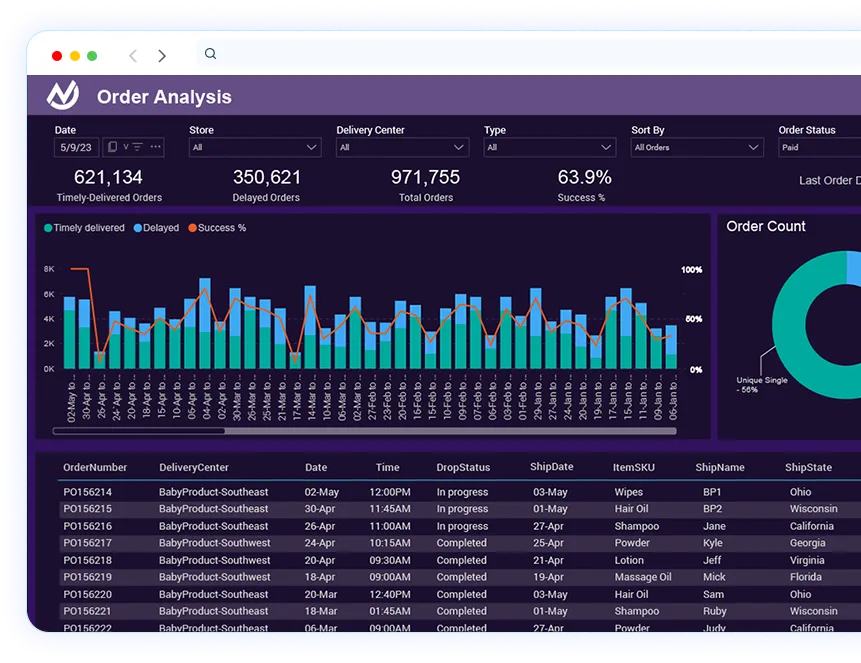
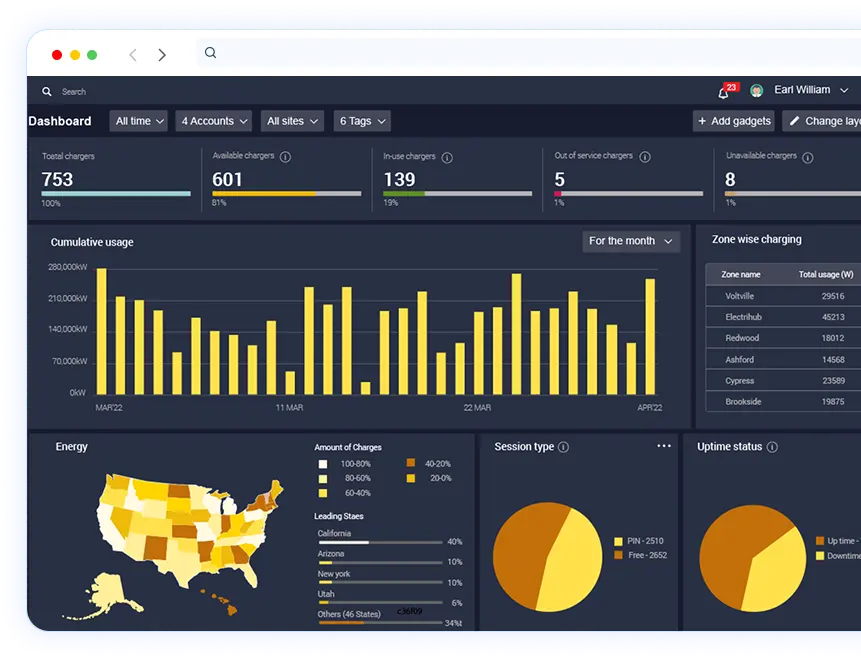
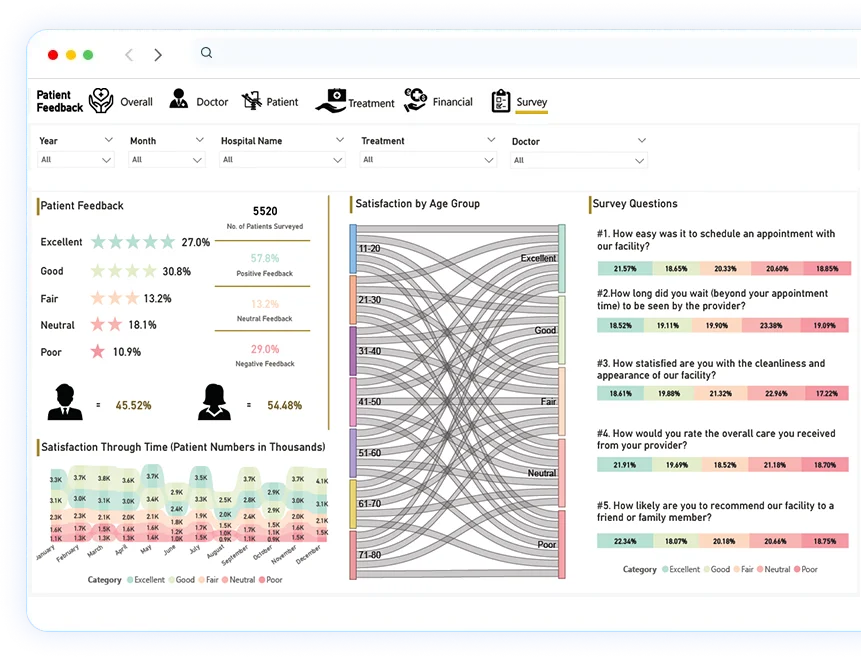
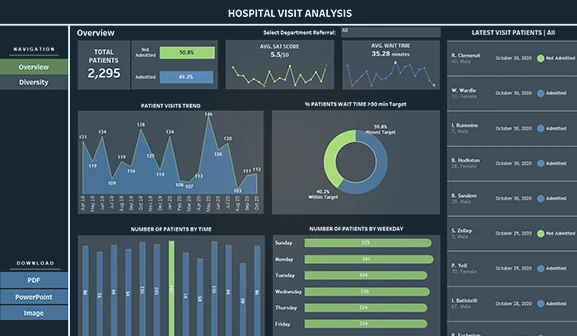
Data holds immense potential when understood visually. Our data visualization services decode intricate datasets, delivering crystal-clear insights that empower strategic decision-making and organizational transformation. With the right data visualization tools, our expert team translates complex information into intuitive, interactive dashboards and graphics. We leverage advanced platforms like Tableau, Power BI, and Logi Analytics to transform raw data into actionable, visually stunning representations. We translate data’s silent language into vivid visual narratives that can drive strategic breakthroughs for you.

Data visualization services

Custom dashboard

Custom dashboard creation

Revolutionize your data landscape with custom dashboards engineered for precision and clarity. Experience a new level of insight as you transform raw data into strategic assets.

BI platform development

BI platform development

Leverage a cutting-edge BI platform that seamlessly integrates and elevates your data ecosystem. Our BI development solutions empower you with a unified view for strategic dominance and operational excellence.

Data visualization

Data visualization optimization

Enhance your data’s impact with optimized visualizations that bring clarity to complex information. Our data visualization experts refine your visuals to ensure you uncover actionable insights efficiently.

Real-time data monitoring--

Real-time data monitoring

Gain a competitive edge with real-time data monitoring that delivers instantaneous visibility and actionable intelligence. Stay agile and responsive to emerging trends with live data insights.

Strategy and consulting

Strategy and consulting

Navigate the data landscape with confidence through our expert strategy and consulting services. We provide tailored guidance to optimize your data strategy and achieve measurable business outcomes.

Data visualization use cases by industry

Healthcare

Operational efficiency

Challenges:

Delayed hospital operations due to inefficient data flow

Solution:

Custom dashboards that integrate patient data, treatment outcomes, and operational metrics for real-time monitoring.

Benefits:

  • Improved patient care
  • Reduced operational costs
  • Data-driven decision making

Retail

Inventory optimization

Challenges:

Overstocking or understocking due to fluctuating demand

Solution:

Develop custom BI platform to monitor inventory and automate alerts on stock levels

Benefits:

  • Minimized stockout and overstock
  • Improved demand forecasting
  • Better monitoring of inventory

Manufacturing 

Production line monitoring

Challenges:

Lack of real-time insights into operational barriers

Solution:

Build real-time data dashboards to monitor machine performance, throughput, and downtime

Benefits:

  • Reduced machine downtime
  • Increased productivity
  • Predictive maintenance

Financial services

Fraud detection

Challenges:

Time-intensive process of irregular pattern detection in large volumes of transactions

Solution:

Create interactive dashboards that highlight anomalies and suspicious activities instantly

Benefits:

  • Faster fraud identification
  • Reduced financial losses
  • Improved compliance

Supply chain

Logistics and route optimization

Challenges:

Inefficient routes lead to delays and high fuel costs

Solution:

Create real-time logistics dashboards integrating GPS and delivery data

Benefits:

  • On-time deliveries
  • Reduced transportation costs
  • Improved logistics planning

Telecommunications 

Network and customer analysis

Challenges:

Difficulty in analyzing network performance and customer satisfaction data simultaneously.

Solution:

Data visualization platforms help telecom companies to track network outages, customer complaints, and service usage patterns.

Benefits:

  • Improved network performance
  • Faster issue resolution
  • Increased customer retention

Marketing

Campaign performance analysis

Challenges:

Inefficient evaluation of ROI across multi-channel campaigns

Solutions

Integrate BI reporting tools to visualize campaign KPIs and performance trends

Benefits:

  • Holistic campaign tracking
  • Optimized ad spend
  • Improved ROI

Success Stories

Maximizing manufacturing efficiency with data engineering

Industry:

Manufacturing

Technologies

Power BI, Snowflake

Challenges

  • Financial losses from incorrect charges
  • Lack of data visualization tools
  • Reliance on VLOOKUP for data modeling

Business impact

  • Improved efficiency with real-time KPI tracking
  • Reduced financial losses with Power BI dashboards
  • Boosted financial performance through cost savings

Client

A leading baby products manufacturer

manufacturing-efficiency-with-data-engineering

Success Stories

Implementing data engineering solution for an EV charging station company

Industry

Renewable Energy

Technologies

Tableau, Salesforce, Oracle NetSuite

Challenges

  • Inefficient monitoring of installation stages
  • Unable to track installation progress
  • Lack of station performance evaluation

Business impact

  • Obtained monthly progress reports with Tableau dashboards
  • Achieved real-time inventory visibility
  • Identified key manufacturers frequenting stations

EV-charging-dashboard

Success Stories

Logi to Power BI migration cuts healthcare report time by 75%

Industry

Healthcare

Technologies

Microsoft Power BI, Azure Data Factory, SQL Server, Oracle, Centralized Data Warehouse, DAX

Challenges

  • Growing volume of patient and operational data from legacy sources
  • Lack of clarity in visualizing intricate data
  • Difficulty integrating with EMR systems and third-party tools

Business Impact

  • Patient feedback dashboard helped track patient satisfaction rates
  • Real-time data became accessible with Power BI migration
  • Integration with EMR systems improved data visibility

logi-to-power-BI-migration-dashboard-withshadow-

What sets Softweb Solutions apart

10+ years of experience in creating data visualization solutions across industries.

60+ experts in Tableau, Power BI, and Logi Analytics for data visualization and transformation.

350+ dashboards created using Power BI and Tableau for better insights.

Intuitive interfaces for non-technical users with Power BI and Tableau.

Adherence to governance and compliance for enterprise environments with Looker and Power BI.

Our Clients

portfolio-logo-1
portfolio-logo-2
portfolio-logo-4
portfolio-logo-3
portfolio-logo-5
portfolio-logo-6
portfolio-logo-7
portfolio-logo-8

Latest Data Visualization Insights

Connect with one of the leading data visualization services companies

Discuss your requirements with our data visualization consultants

user1
user2
user3