 Dec 30, 2024
Every click, every query, every dashboard you build shapes how your business interprets data. However, with multitude of data visualization tools, the stakes are high. Choosing the wrong tool could mean bottlenecks in analytics or wasted resources. This isn’t just about features; it’s about crafting a data analytics strategy that delivers precision, scalability, and innovation.
This blog goes beyond level comparisons, which will explore these BI giants head-to-head into real-world scenarios. We aim to assist you to pinpoint the best tool that aligns with your business goals. Let’s explore the comparison of Power BI, Tableau, Qlik, and Looker.
Overview of Power BI, Tableau, Qlik Sense, and Looker
Power BI
Power BI is known to be very seamlessly integrated within the Microsoft ecosystem, starting from Microsoft 365 up to Azure. It has user-friendly interfaces and is cost-effective, making it accessible for businesses of all sizes.
Looking for Microsoft Power BI consulting services?
Our Power BI developers can help you extract valuable insights from data, thus further enhancing data exploration and decision making. Our Power BI solutions simplify data infrastructure and help reduce costs.

Tableau
Tableau is considered one of the best software available for data visualization with some advanced capabilities that allow it to provide interactive and sharable dashboards. Tableau has a great extent of depth in analytical features.
Qlik Sense
Qlik Sense provides an associative data model allowing data exploration without the limitations of a query-based tool. It offers robust data integration and is designed for interactive analysis.
Looker
Part of the Google Cloud, Looker is a cloud-native business intelligence tool that uses a modeling language called LookML to create custom data experiences. It is particularly effective in its capability to embed analytics into workflows and applications.
Radar-chart comparison of Power BI vs Tableau vs Qlik Sense vs Looker
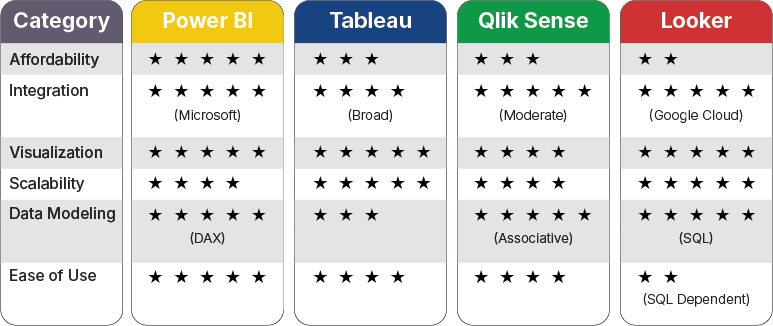
Let’s compare these data visualization tools in detail.
Comprehensive feature comparison
1. Data connectivity
| Feature | Power BI | Tableau | Qlik Sense | Looker |
|---|---|---|---|---|
| Data source support | Wide variety, especially Microsoft tools | Extensive (cloud, on-premises, APIs) | Broad range, strong associative model | Primarily SQL-based and cloud-native |
| Ease of integration | Seamless in the Microsoft ecosystem | Flexible but requires setup | Advanced real-time connections | Exceptional for modern cloud platforms |
| Cloud compatibility | Azure-centric but supports multi-cloud environments | Multi-cloud compatible | Multi-cloud, hybrid setups supported | Fully cloud-native |
Key takeaways:
- Power BI is ideal for Microsoft-focused businesses.
- Tableau and Qlik Sense offer flexibility across environments.
- Looker excels in cloud-first, SQL-based connectivity.
2. User interface and experience
| Feature | Power BI | Tableau | Qlik Sense | Looker |
|---|---|---|---|---|
| Ease of use | Intuitive for beginners | User-friendly with a learning curve | Moderate; requires scripting skills | Steep for non-technical users |
| Dashboard interactivity | High (drag-and-drop functionality) | High (interactive and visual-driven) | Moderate; customizable associations | Moderate; designed for developers |
| Customization | Moderate | Advanced | High (via mashups) | High (via LookML and APIs) |
Key takeaways:
- Power BI and Tableau provide intuitive interfaces for non-technical users.
- Qlik Sense and Looker cater to users comfortable with coding or customization.
Enhancing operational efficiency with Power BI for an energy company
Softweb Solutions helped an energy company enhance efficiency by integrating Power BI for real-time data analysis. This solution improved operational visibility, reduced manual reporting, and optimized decision making.

3. Visualization capabilities
| Feature | Power BI | Tableau | Qlik Sense | Looker |
|---|---|---|---|---|
| Visual design | Pre-designed templates, moderate visuals | Best-in-class interactive visuals | Good visuals with strong exploration | Minimal, dependent on LookML |
| Interactivity | High, but less dynamic than Tableau | Excellent (drill-downs, animations, etc.) | Moderate (associative analytics) | Limited; focuses on data models |
| Custom visuals | Marketplace for additional visuals | Fully customizable | Requires extensions or custom scripting | Requires API and LookML expertise |
Key takeaways:
- Tableau leads in visual storytelling and customization.
- Power BI offers easy-to-use templates, while Qlik Sense excels in exploratory analytics.
4. Data security and governance
| Feature | Power BI | Tableau | Qlik Sense | Looker |
|---|---|---|---|---|
| Row-level security | Supported | Supported | Supported | Advanced via LookML |
| Data governance | Moderate | Low (depends on integrations) | Moderate | High (centralized governance in LookML) |
| Compliance | GDPR, SOC, HIPAA via Azure | Varies based on deployment | Strong compliance support | Strong for modern data stacks |
Key takeaways:
- Looker and Power BI excel in governance and compliance for enterprise environments.
- Tableau and Qlik Sense require additional configurations for robust governance.
5. Pricing and licensing
| Feature | Power BI | Tableau | Qlik Sense | Looker |
|---|---|---|---|---|
| Pricing model | Affordable (monthly plans) | High (user-based and server options) | Moderate (flexible licensing) | Premium (enterprise-focused) |
| Total cost of ownership | Low | High | Moderate | High |
Key takeaways:
- Power BI is a cost-effective option for businesses of all sizes.
- Tableau and Looker are best suited for larger enterprises with higher budgets.
Suggested: Power BI vs Microsoft Fabric: Exploring the complementary powers of these tools
6. Scalability and performance
| Feature | Power BI | Tableau | Qlik Sense | Looker |
|---|---|---|---|---|
| Scalability | High for Azure users | High | High | Excellent for cloud-native solutions |
| Performance | Strong for small to medium datasets | Strong for complex dashboards | Excellent for large, real-time datasets | Depends on cloud and warehouse setup |
Key takeaways:
- Qlik Sense and Looker excel in large-scale environments.
- Power BI and Tableau perform well for medium-scale implementations.
Comparison of strengths, limitations, and best fit for Power BI, Tableau, Qlik Sense, and Looker
| Tool | Strengths | Limitations | Best fit |
|---|---|---|---|
| Power BI |
|
|
|
| Tableau |
|
|
|
| Qlik Sense |
|
|
|
| Looker |
|
|
|
Suggested: A comprehensive guide to Power BI migration
Insights from Gartner Peer Reviews
To provide a well-rounded comparison of Power BI, Tableau, Qlik Sense, and Looker, we’ve included insights from Gartner Peer Reviews, reflecting real-world user experiences and satisfaction across critical metrics.
| Criteria | Power BI | Tableau | Qlik Sense | Looker |
|---|---|---|---|---|
| Overall rating | 4.4/5 | 4.4/5 | 4.3/5 | 4.5/5 |
| Ease of use | Simplified for Microsoft users | User-friendly for analysts | Moderate learning curve | Steep for non-technical users |
| Customer support | Highly rated | Moderate | Moderate | Strong |
| Likelihood to recommend | 85% | 85% | 82% | 88% |
By considering the Gartner insights along with the feature comparisons, organizations can take informed decisions based on their specific needs and operational priorities.
Which BI tool is right for your organization?
A business-intelligence tool may vary for any organization depending upon its size, goals, technical infrastructure, and level of expertise the users have about such BI tools. Here’s an easy guide:
- If you are a small-to-medium business or an enterprise deeply invested in the Microsoft ecosystem, choose Power BI. It is cost-effective, intuitive, and works well with tools like Excel and Azure.
- Opt for Tableau if advanced visualization and intuitive storytelling are your top priorities. It’s ideal for teams that require stunning, interactive dashboards to drive decision-making.
- Go with Qlik Sense when you are dealing with vast datasets and need something that can unwrap complex relationships in data via its associative model. Its scalable backend makes it wonderful for self-service analytics.
- Looker is best suited if you are cloud-native and have data-savvy teams that thrive on SQL. It is best suited for organizations that are on Google Cloud and are looking to embed analytics into applications.
With an understanding of the strengths of each platform and aligning it with your business needs, you can ensure that your BI solution not only enhances decision making but scales with your growth.
Let’s help you choose the right data visualization tool
The right BI tool is often the one that best matches your data strategy and business goal. Power BI is therefore a cost-effective solution that thrives in the Microsoft ecosystem but delivers powerful analytics with little effort. Tableau redescribes visual storytelling, with businesses where aesthetics meet actionable insights. Qlik Sense’s associative model unlocks intricate relationships in complex data structures, making it indispensable in the face of big, dispersed datasets. Looker’s native-cloud foundation and developer-friendly approach puts power in the hands of data-savvy teams so that they can build one-off analytics solutions. Each one is a different lens in which your data can tell its story—pick the one that aligns with how you envision your narrative.
If you are uncertain of which tool is suitable for your needs or require additional support, data visualization consulting company like Softweb Solutions can assist you by demystifying the best possible options for you. We can direct you to choose and deploy the appropriate BI solution, considering your company’s specific needs. Talk to our data consultants to know more.
Need Help ?
We are here for you